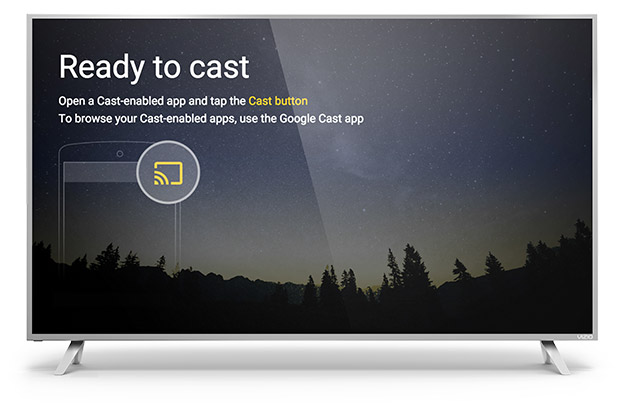
If you’re a web developer or need to access the browser console on your Mac, here’s how to do it. First, open Chrome and go to the View menu. Next, select Developer > JavaScript Console.
This will open the console at the bottom of your screen. If you don’t see the console, try refreshing the page.
- Open Chrome on your Mac
- Click the Chrome menu button in the top-right corner of the window
- Select More Tools > Developer Tools from the drop-down menu that appears
- The Developer Tools window will open at the bottom of your screen
- Click the Console tab at the top of the window to open the Browser Console
How Do I Open the Console in Chrome on a Mac?
To open the console in Chrome on a Mac, you will need to first open the Developer Tools. To do this, go to View > Developer > Developer Tools. This will open the DevTools in a separate window.
Once the DevTools are open, click on the Console tab. This will bring up the console where you can enter commands and see any errors that may have occurred on the page.
How Do I Open Inspect Console on Mac?
If you’re a web developer, chances are you’ve had to use the Inspect Console at one point or another. The Inspect Console is a tool that allows you to view and change the HTML and CSS of a web page in real-time. It’s a great tool for debugging your code, and it can also be used to make last-minute changes to a web page before you publish it.
So how do you open the Inspect Console on a Mac? There are actually two ways to do it. The first way is to use the keyboard shortcut: Command + Option + I (or Cmd+Opt+I).
This will open the Inspector window in Safari. You can also access the Inspector window by going to Safari > Preferences > Advanced, and then checking the “Show Develop menu in menu bar” box. Once you’ve done that, you’ll see a new “Develop” menu item in your Safari menu bar.
From there, simply select “Show Web Inspector.” The second way to open the Inspect Console is by using Google Chrome. In Chrome, go to View > Developer > JavaScript Console.
This will open up the JavaScript console, which has a lot of features similar to the Inspect Console in Safari. However, keep in mind that not all browsers have an equivalent of the Inspect Console/JavaScript console. So if you’re having trouble getting something working in one browser but not another, this could be why.
Overall, opening up the Inspect Console on your Mac is relatively simple – just use either Keyboard Shortcut or find it under your browser’s menus!
How Do I Open F12 in Chrome on a Mac?
Assuming you would like tips for opening the Developer Tools in Google Chrome on a Mac:
1. Open Chrome and go to the website that you want to inspect.
2. Click on View at the top of your screen and then select Developer>Developer Tools. The keyboard shortcut is Option+Command+I.
3. This will open up the Developer Tools pane at the bottom of your screen. If you want it to open as a separate window, click on the three dots at the top right corner of the pane and select Undock into separate window from the drop-down menu.
4. To access specific tools, click on one of the icons at the top of the pane or go to View>Developer>[tool name]. For example, if you want to use the JavaScript Console, go to View>Developer>JavaScript Console or press Command+Option+J.
What is the Browser Console on Mac?
The browser console on Mac is a developers tool that allows you to see various messages that are logged by the web browser as it loads and renders a web page. This can be useful for troubleshooting issues with web pages or tracking down errors. To access the browser console on Mac, open the Safari menu and select “Develop” > “Show Web Inspector“.
How to Open Console on Chrome
Assuming you would like a blog post discussing how to open the Chrome Developer Tools: The Chrome Developer Tools are a set of web authoring and debugging tools built into Google Chrome. The Developer Tools are divided into several panels, each of which can be opened using the menu at the top of the window or by pressing a keyboard shortcut.
To open the Developer Tools, do one of the following: * Press Ctrl+Shift+I (Windows) or Cmd+Opt+I (Mac). * Right-click on any page element and select Inspect Element.
Once you have opened the Developer Tools, you will see a bar at the bottom of your screen with various tabs. These tabs allow you to access different features within the Developer Tools. For example, the Elements tab allows you to view and edit HTML and CSS code for your web pages.
If you’re new to using developer tools, we recommend checking out Google’s official documentation which provides more detailed information about each panel in the developer tools.
Conclusion
Assuming you would like a summary of the blog post titled “How to Open Browser Console on Mac Chrome“: The browser console is a tool that allows you to view and debug JavaScript code running in the browser. It can be used to view errors, inspect element styles and attributes, and monitor network requests.
On Mac, the browser console can be opened using the keyboard shortcut ⌥⌘J (Option+Command+J).